EP3: The Ladder of Causation: Why Predicting Isn’t the Same as Changing Outcomes
1. The Nightmare: Why Your Model Didn’t Move the Metric
You spend three months building a model. You have petabytes of user data. You ship a feature because your model says X and Y move together. You are confident.
And then… nothing. The dashboard stays flat.
This is the specific nightmare of the modern data scientist: explaining to stakeholders why the math worked, but reality didn’t. The reason usually isn’t a bug in the code — it’s a mismatch between the question you needed and the tool you used.
- Prediction tools answer: What happens when I observe X?
- Decision questions ask: What happens if we change X?
That mismatch is the Data Validity Cliff: observational data is solid ground for prediction, but the ground disappears the moment you try to use it to justify an intervention.
Failure Mode: Selection vs. Policy
This happens because teams confuse targeting with impact:
- The Observation: “Power users adopt Feature X.”
- The Mistake: Assuming “Shipping Feature X will make users engaged.”
- The Reality: Without a causal framework, you cannot distinguish between Selection (finding people who already love you) and Policy (changing user behavior).
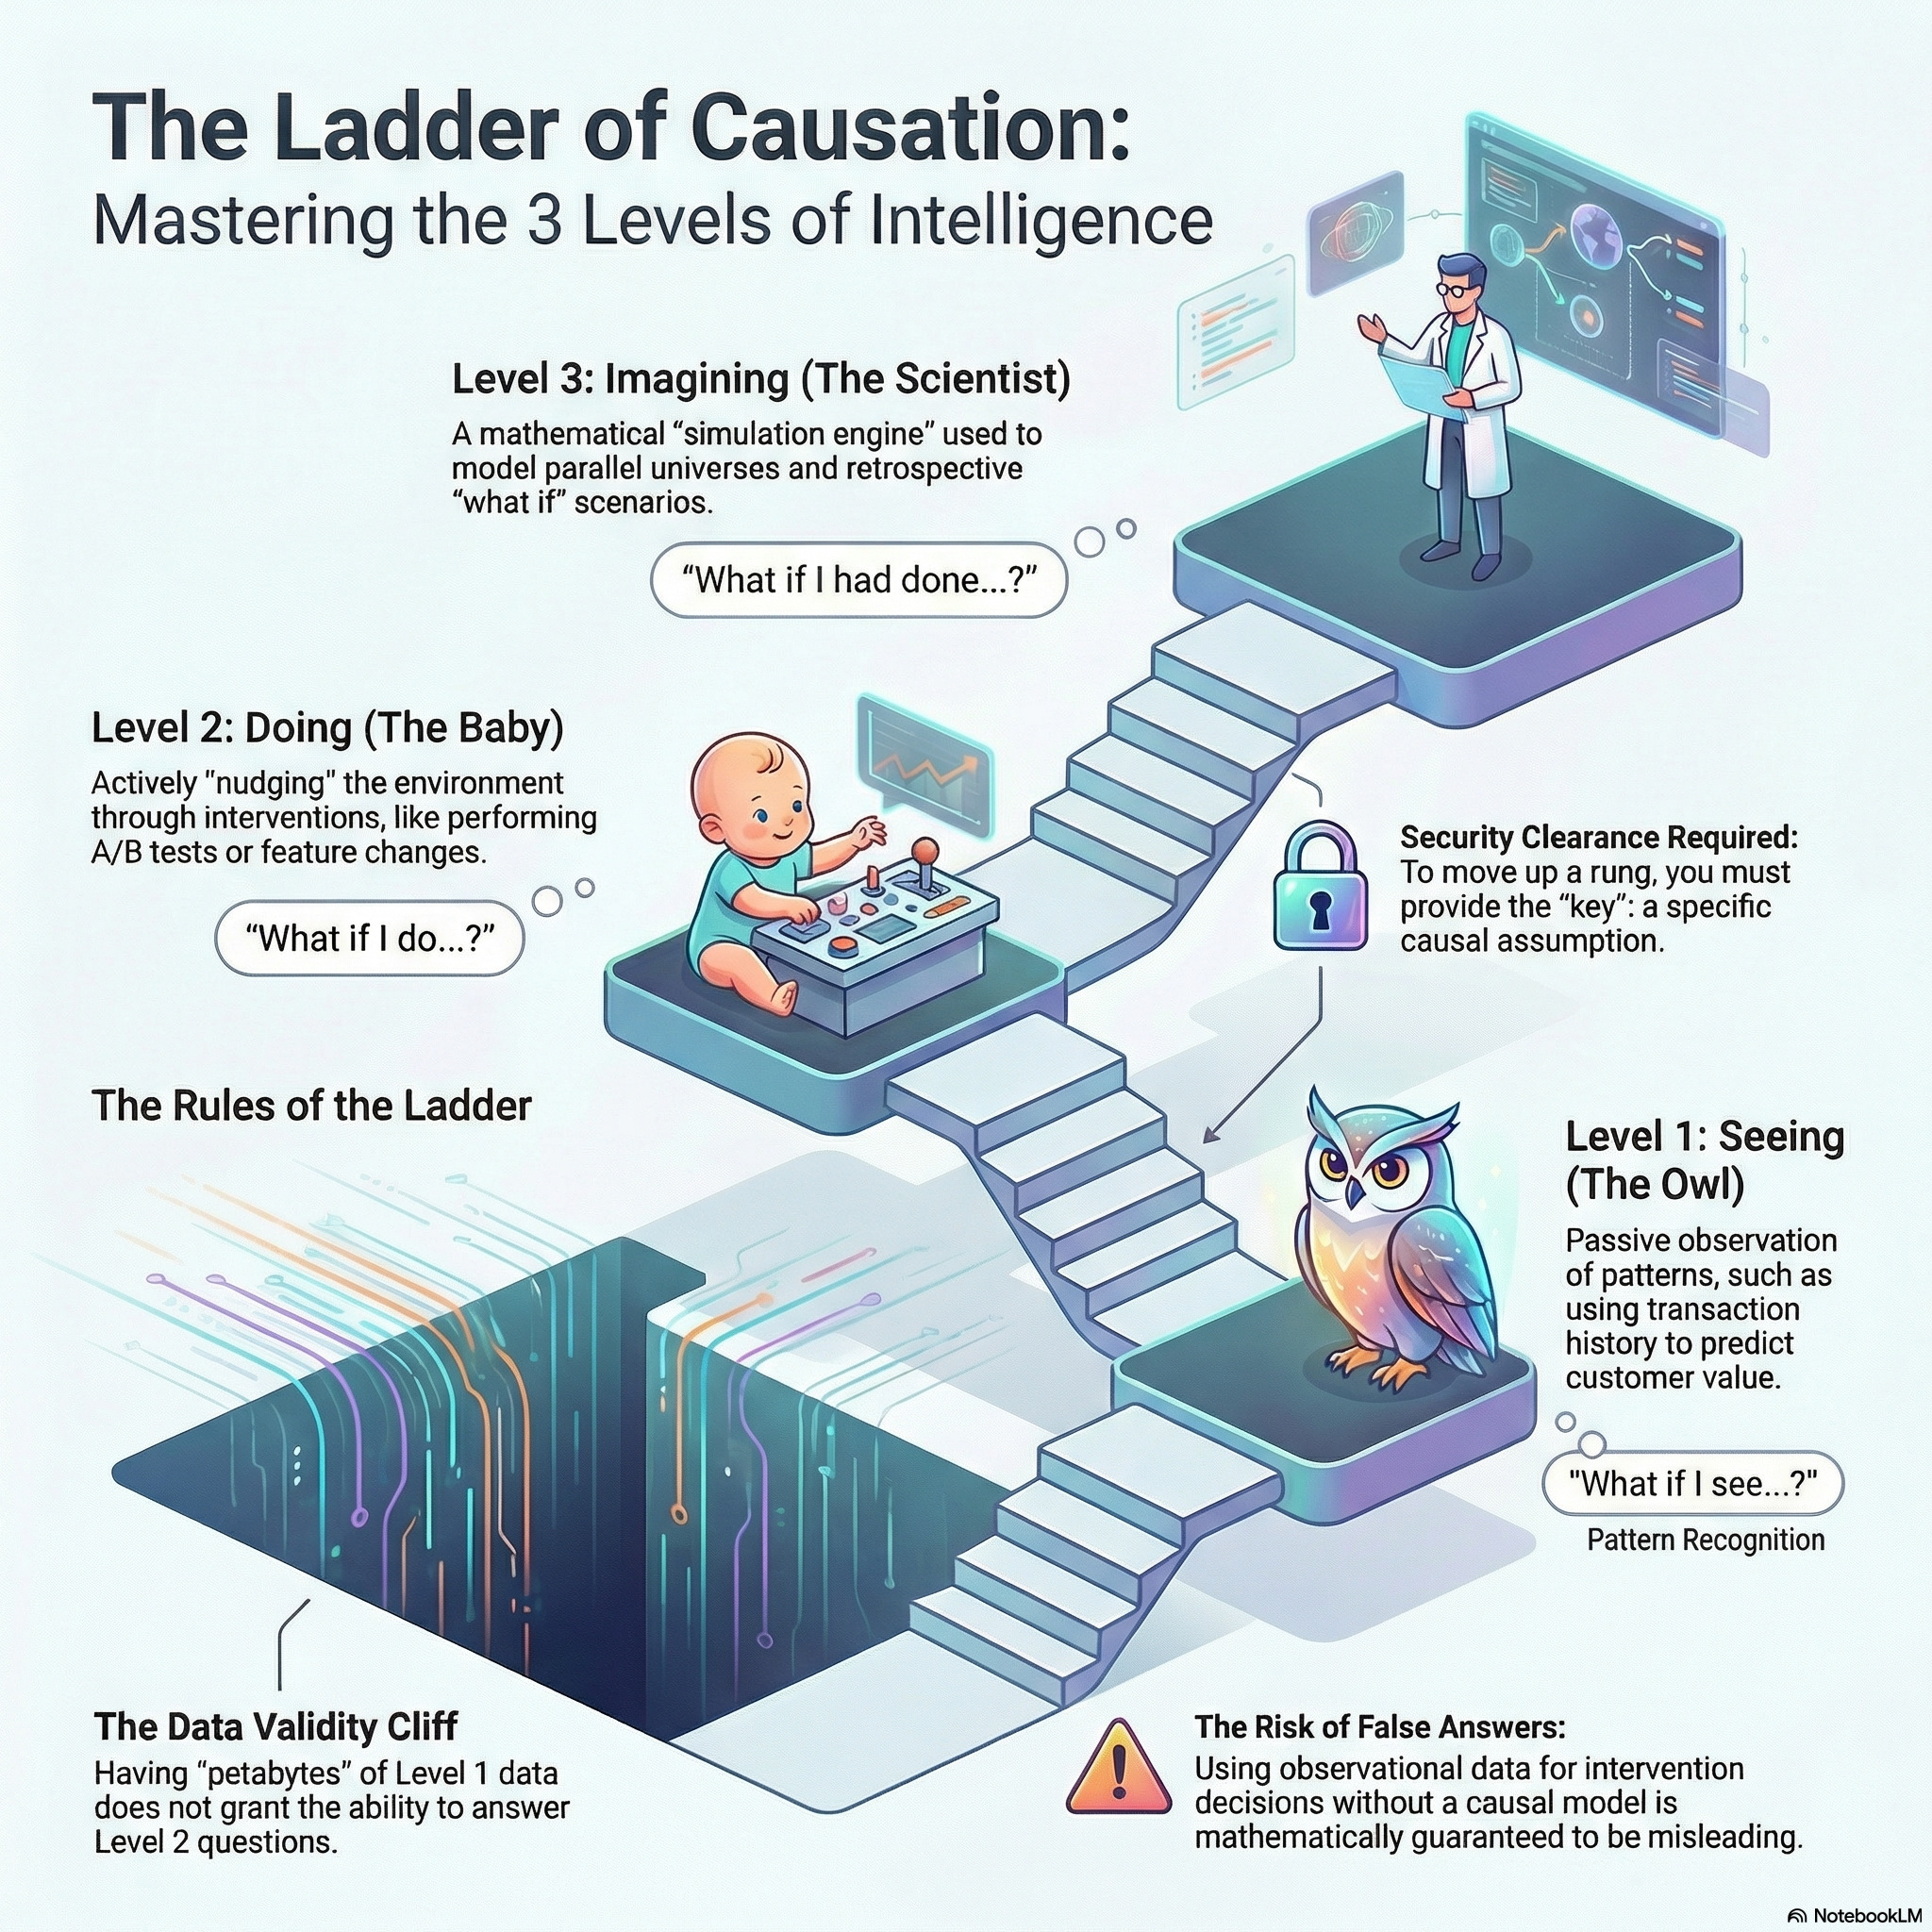
To avoid this, we need to climb The Ladder of Causation (Pearl’s Causal Hierarchy (Bareinboim et al. 2022)). It is a map that separates questions into three distinct levels.
- Association: what patterns exist?
- Intervention: what happens if we change something?
- Counterfactuals: what would have happened otherwise?
Listen to This Episode
Want to dive deeper into the ladder of causation? This podcast episode provides more in-depth information and intuition about the topic. So do tune in and follow the podcast to get notified when the next episode is out!
2. Causal Hierarchy: Three Levels of Reasoning
Pearl’s hierarchy is often illustrated with a ladder and three characters—the Owl, the Baby, and the Scientist—each representing a different kind of question we can (and cannot) answer.
Level 1: Association (The Owl) — The Trap
- Activity: Seeing/Observing.
- Core Question: “What happends when I I see X?”
- Assumptions: At this level, assumptions are purely statistical (functional form, independence, stationarity, etc.).
- Mathematical signature: \(P(y|x)\) — the probability of \(Y\) given we observe \(X\).
The Owl is a master observer. Think of it as an alerting system:
“When checkout error rate spikes, conversion usually drops soon after.”
That pattern is extremely valuable for prediction and monitoring. But it does not yet tell you whether fixing error rate will cause conversion to rise—because the same pattern can be explained by multiple causal stories (common causes, measurement artifacts, reverse direction, etc.).
This is the home of ML as superpowered observation.If you train a model to predict \(Y\) from \(X\), you’re building a very high-tech Owl. It answers questions like:
- who is likely to churn?
- which sessions look risky?
- what content will this user click?
It does not answer “what should we change?”
Level 2: Intervention (The Baby) — The Action
- Activity: Doing and Intervening.
- Core Question: “What if I do X?” In other words: What is the effect of an action?
- Mathematical signature: \(P(Y \mid do(X))\) — the probability of \(Y\) given we force \(X\) to happen.
A baby knocks over blocks. It learns by changing the world and observing what happens. That’s Level 2: we care about the effect of actions—shipping a feature, changing ranking, adjusting price, redesigning checkout.
- What we need: To answer Level 2 questions, we need either:
- Interventional data (e.g. randomized controlled trials (A/B testing) / randomized encouragement designs / switchbacks / geo tests), or
- A causal model + identifying assumptions that let us recover \(P(y|do(x))\) from non-experimental data.
- Interventional data (e.g. randomized controlled trials (A/B testing) / randomized encouragement designs / switchbacks / geo tests), or
This is where product decisions live: shipping, ranking changes, pricing policy, new UX, recommendation updates.
A/B testing is the cleanest path because it manufactures the “do.” When you can’t randomize, you can still aim for Level 2—but only with identifying assumptions, e.g. exchangeability / no unmeasured confounding, SUTVA - (e.g., avoid spillovers and “multiple versions of treatment”), and Positivity.
Level 3: Counterfactuals (The Scientist) — The Simulation
- Activity: Imagining “what would have happened otherwise” — simulating parallel worlds.
- Core Question: “What would have happened if we acted differently, given what actually happened?”
- Mathematical signature: \(P(y_x \mid x', y')\) — the probability that \(Y\) would be \(y\) under \(X=x\), given that we actually observed \(X=x'\) and \(Y=y'\).
The Scientist’s superpower is not imagining—it’s building a laboratory: a model that can simulate a world that never happened.
This is the rung people often misunderstand, so let’s be explicit:
Why A/B testing are Level 2, not Level 3
A randomized experiment tells you the average causal effect of a treatment across a population—that’s a Level 2 answer. It does not tell you what would have happened to a specific individual under the alternative. To answer that, you need a structural causal model with additional assumptions about how outcomes are generated.
Why do we care about level 3?
Because many business questions are about Generalization and transportability across contexts. Level 2 can tell you what works on average, but it cannot tell you if a specific user would have stayed if you had given them a coupon. To answer that, you need to simulate the “road not taken” for that user, which is a Level 3 question.
In business, we often estimate an effect in one context (e.g., UK traffic) and want to apply it elsewhere (e.g., US traffic).
Staying at Level 2 often means: “We tested here, so we need to re-test there.” A more structural view (closer to Level 3 thinking) helps you ask: what mechanism is stable vs. what differs across contexts, and whether you can adjust or re-estimate efficiently.
This isn’t “skip experiments.” It’s about understanding what you can safely reuse, and what you can’t.
Level 3 shows up when you need statements like:
- “Would this user have churned anyway?”
- “Would this incident have happened without the policy change?”
To answer these, randomization helps (by anchoring causal effects), but you still need structural assumptions to map those effects into counterfactual worlds for specific units or cross-world quantities.
3. Crossing the levels: where identification comes in
Causal inference is about understanding when—and how—we can cross these barriers.
From Level 1 → Level 2 (Association → Intervention)
This is where identification enters in the classic sense: under the right assumptions, we can recover an interventional quantity from observational data.
You can think of identification as the “bridge” that connects:
- what you can estimate from data (\(P(y|x)\)), and
- what you actually want for decisions (\(P(y|do(x))\)).
From Level 2 → Level 3 (Intervention → Counterfactual)
This step is different.
Even with perfect experiments, Level 3 typically needs an additional ingredient: a structural model that can represent “what would have happened otherwise” for specific units, or compute cross-world queries like \(P(y_x \mid x', y')\).
So:
- Level 2 is about effects of actions (often identified by experiments).
- Level 3 is about alternative histories, and it requires structural assumptions to connect those histories.
4. The Diagnostic: A Survival Checklist
How do you know if you are about to fall off the cliff? Use this “Smell Test” before presenting your results.
☑ The “Do” Check (Level 1 vs. Level 2)
Ask yourself: Does my question ask about the effect of an action, or just about patterns in the data?*
- If NO: You are strictly at Level 1 (The Owl). You cannot claim your feature drives engagement. You can only claim it predicts it.
- The Defense: Use this to push back on stakeholders demanding causal answers from observational data.
☑ The Transportability Check (Level 2 vs. Level 3)
Ask yourself: Am I taking a result from one context (e.g., UK Traffic) and applying it to another (e.g., US Traffic)?
- The Risk: Just because it worked in the UK (Level 2) doesn’t mean it works in the US. The environments have different structures (laws, road sides).
- The Fix: This is a Level 3 problem. You need a structural model to “transport” the data. Without a model, you are just guessing.
5. Summary: Pick Your Rung
Keep going
Up next (EP4): Potential Outcomes.
In the next episode, we’ll introduce the potential outcomes framework—the workhorse language for causal inference in practice.
We’ll unpack the fundamental problem of causal inference (why even randomized experiments don’t give individual counterfactuals), and show how this naturally leads to population causal effects of interest like the Average Treatment Effect (ATE).
If you want the “bridge” from association to intervention—i.e., when you’re allowed to interpret an estimate as causal—EP2 goes deeper on identification and the role of assumptions in making causal claims.