EP2: Build the Camera — How Measurement Design Guides Statistical Testing
Running a statistical test is pressing the shutter. Designing a measurement system is building the camera.
![]()
In experimentation discussions, I often hear: “Is the metric power-law distributed?” “Does the Central Limit Theorem apply?” “Should we run a t-test or a Mann-Whitney U?” These questions matter — but they come second. The first question is whether your metric actually captures a meaningful change in user behaviour.
In practice, leverage rarely comes from identifying the exact distribution. It comes from designing better measurements — choosing metrics that reflect real business impact, and reducing noise so true product improvements show up clearly. If the measurement isn’t right, no statistical test will save it.
In this post, we walk through one practical example of how measurement design guides statistical choice — using the rank transformation. For the full mathematical treatment, see the Booking.com data science blog post I wrote with Sam Bailey.
Listen to This Episode
Want to dive deeper into measurement design and rank transformation? This episode of the podcast walks through the intuition and practical implications.
1. The Problem: When Noise Drowns the Signal
Consider a metric that tracks session duration. The distribution is heavily right-skewed — most users browse for a few minutes, but a handful stay for hours, and those outliers dominate the variance. You run an A/B test on a new feature. The feature genuinely improves engagement for most users, but the t-test returns \(p = 0.34\). Not significant.
The feature works. The test cannot see it.
This is not a sample size problem. Adding more users will not fix a metric where a few extreme values swamp the signal. The issue is the measurement — the raw metric amplifies noise from outliers and suppresses the pattern that matters.
The natural instinct is to transform the data — take the log, hope the distribution looks more normal. But a log transformation does not just change the shape. It changes what you are measuring: the geometric mean instead of the arithmetic mean, with a different variance structure (Feng et al. 2013; West 2022). Even if the histogram looks better, you may now be answering a question nobody asked.
The point is not that log transformation is wrong — it is that any transformation changes the measurement, and that change must be driven by the business question. What does the stakeholder need to know? If the answer is “by how many minutes,” keep the raw scale and invest in variance reduction. If the answer is “does this feature make users better off,” a transformation that strips out noise and preserves direction may be the right design choice.
2. Rank Transformation: Reshaping the Measurement
The rank transformation replaces each observation with its rank in the combined sample. The largest outlier becomes the highest rank — its magnitude no longer matters, only its position.
![]()
This does three things:
- Eliminates outlier influence. Whether a user browsed for 10 minutes or 5 hours, their rank is the same.
- Normalises the distribution. Ranks follow a roughly uniform distribution, regardless of the original shape.
- Preserves ordering. If user A spent more than user B in the raw data, A still outranks B.
After rank transformation, you can run a standard t-test on the ranks. Mathematically, this is nearly equivalent to the Mann-Whitney U test (Zimmerman 2012). In simulations across skewed, heavy-tailed, and multimodal distributions, the statistical decisions diverge in fewer than 0.05% of cases (Bailey and Jia 2020).
But replacing observations with ranks changes more than the distribution — it changes the question. The t-test asks: is the mean the same in both groups? The rank-transformed t-test asks: is a random draw from one group equally likely to exceed a random draw from the other?
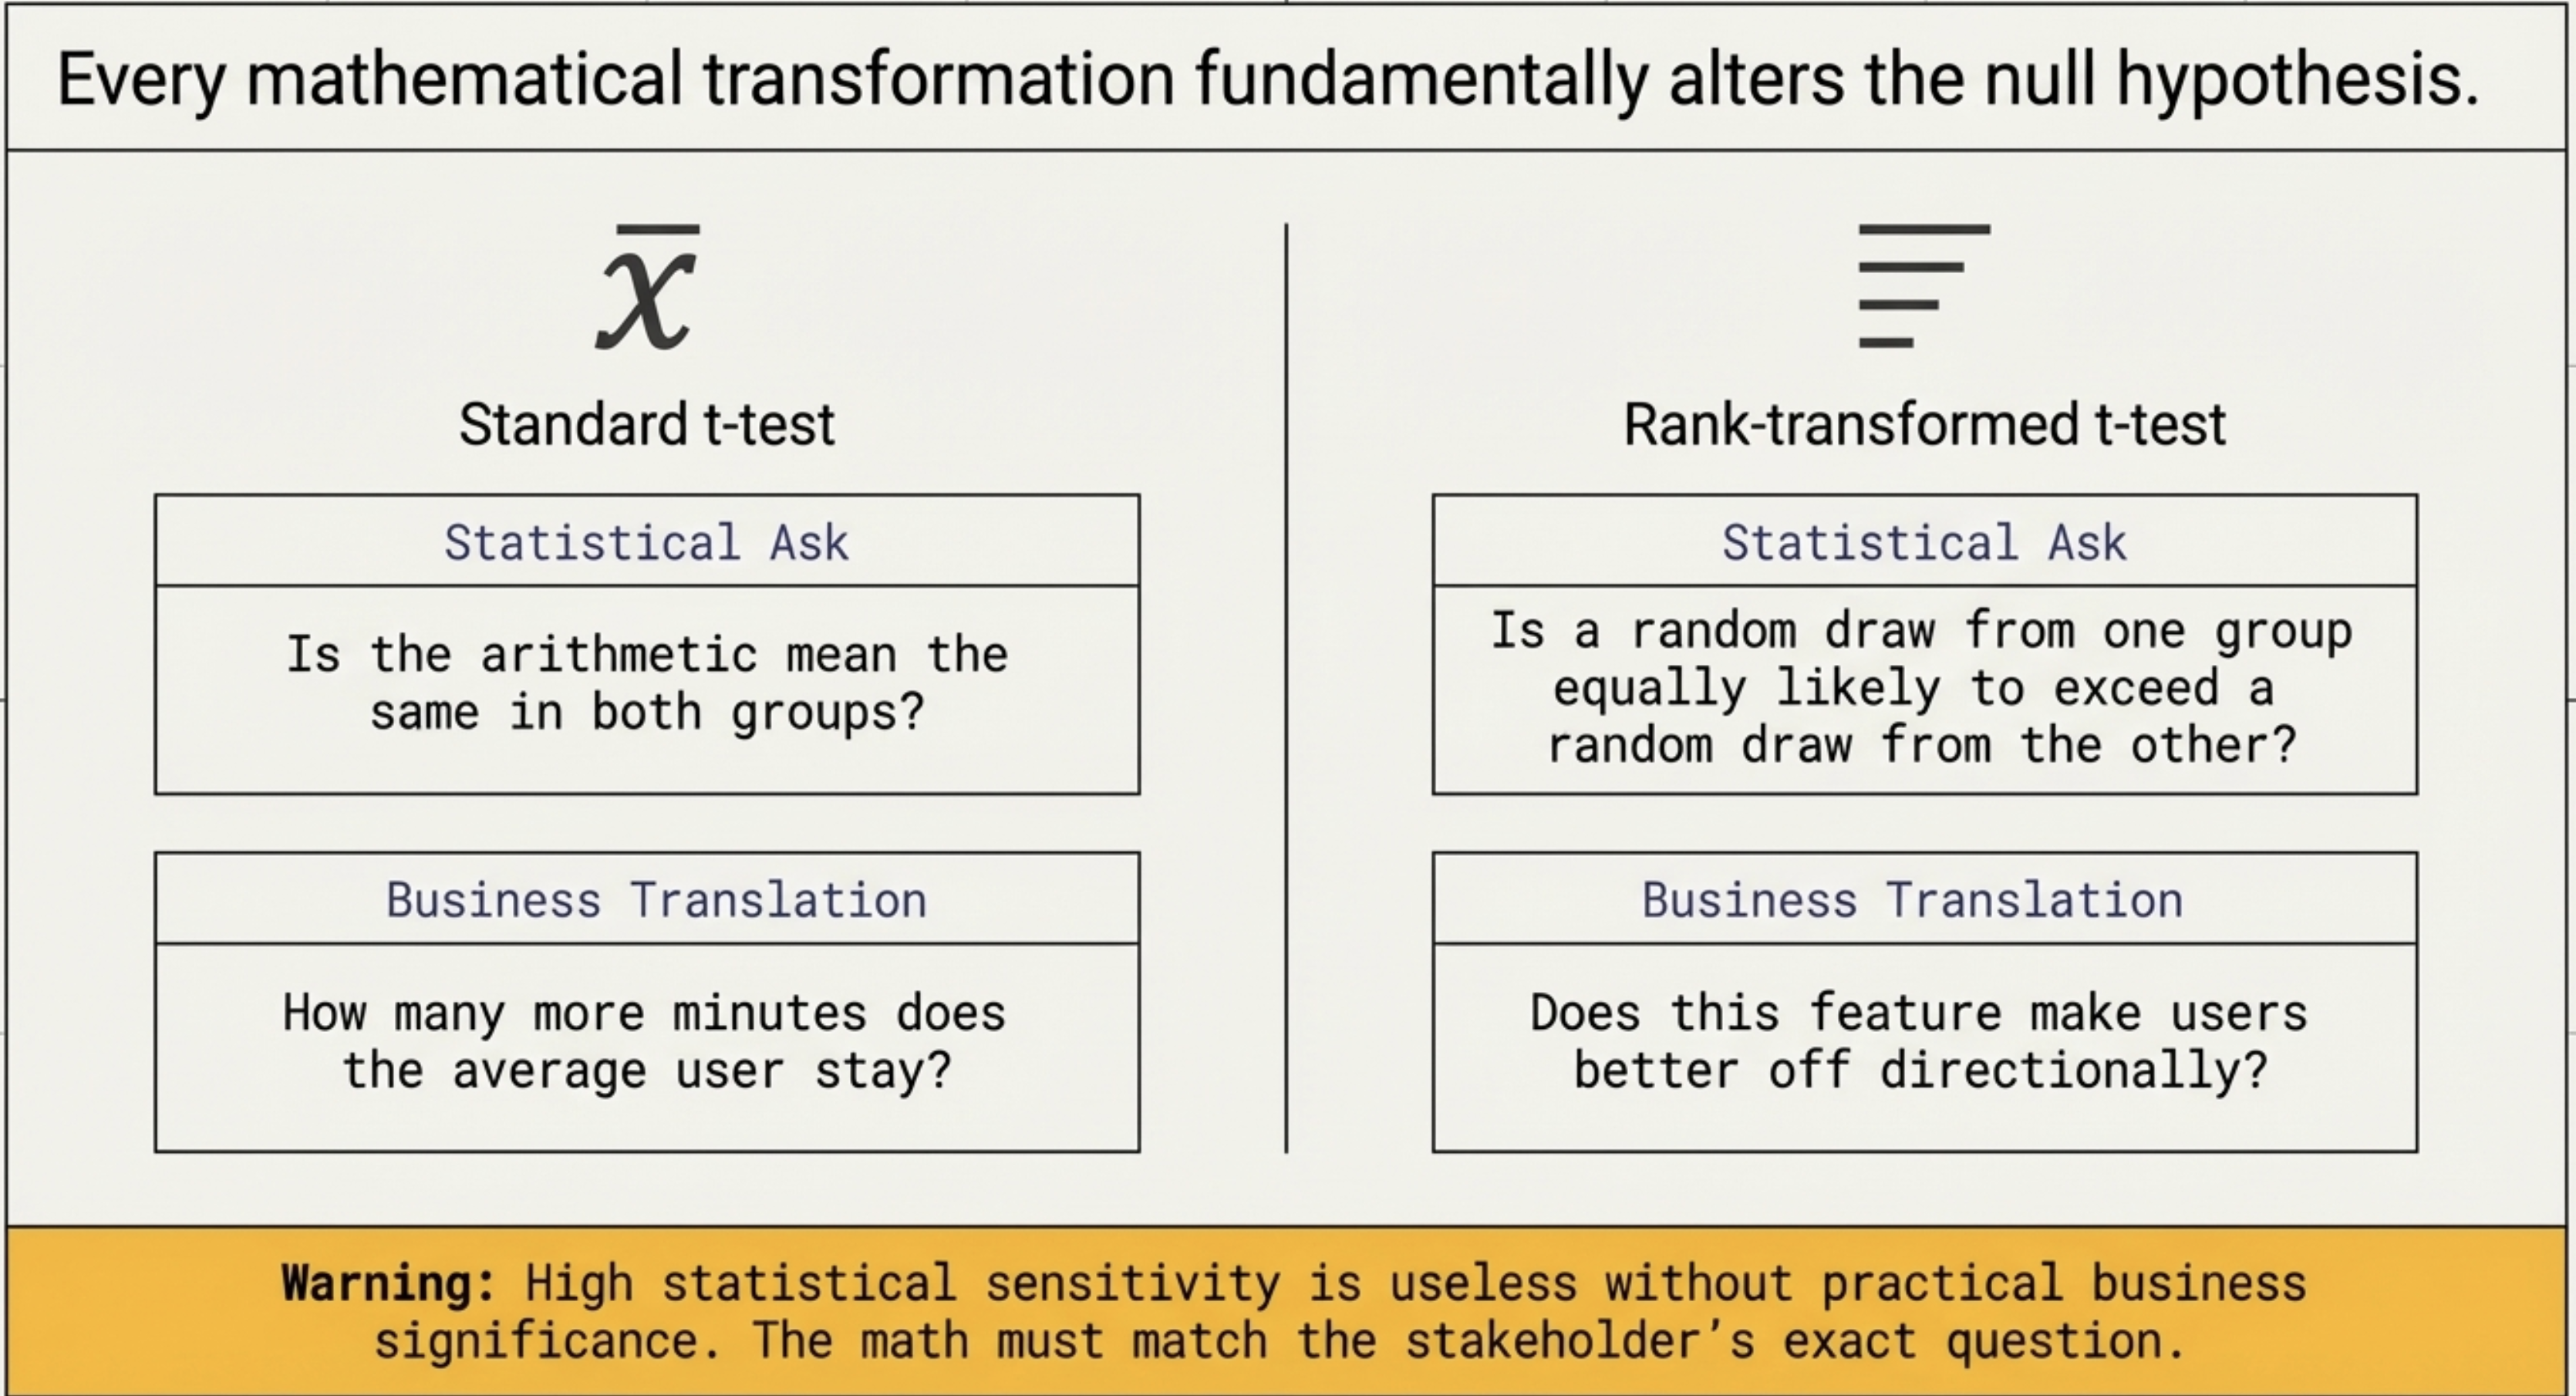
For our session duration case, that distinction works in our favour — the product team is asking exactly the directional question the rank test answers.
3. How Much Does It Help?
To see the impact, we simulate a heavy-tailed session duration metric and compare the statistical power of four approaches: the raw metric, log transformation, rank transformation, and covariate adjustment.
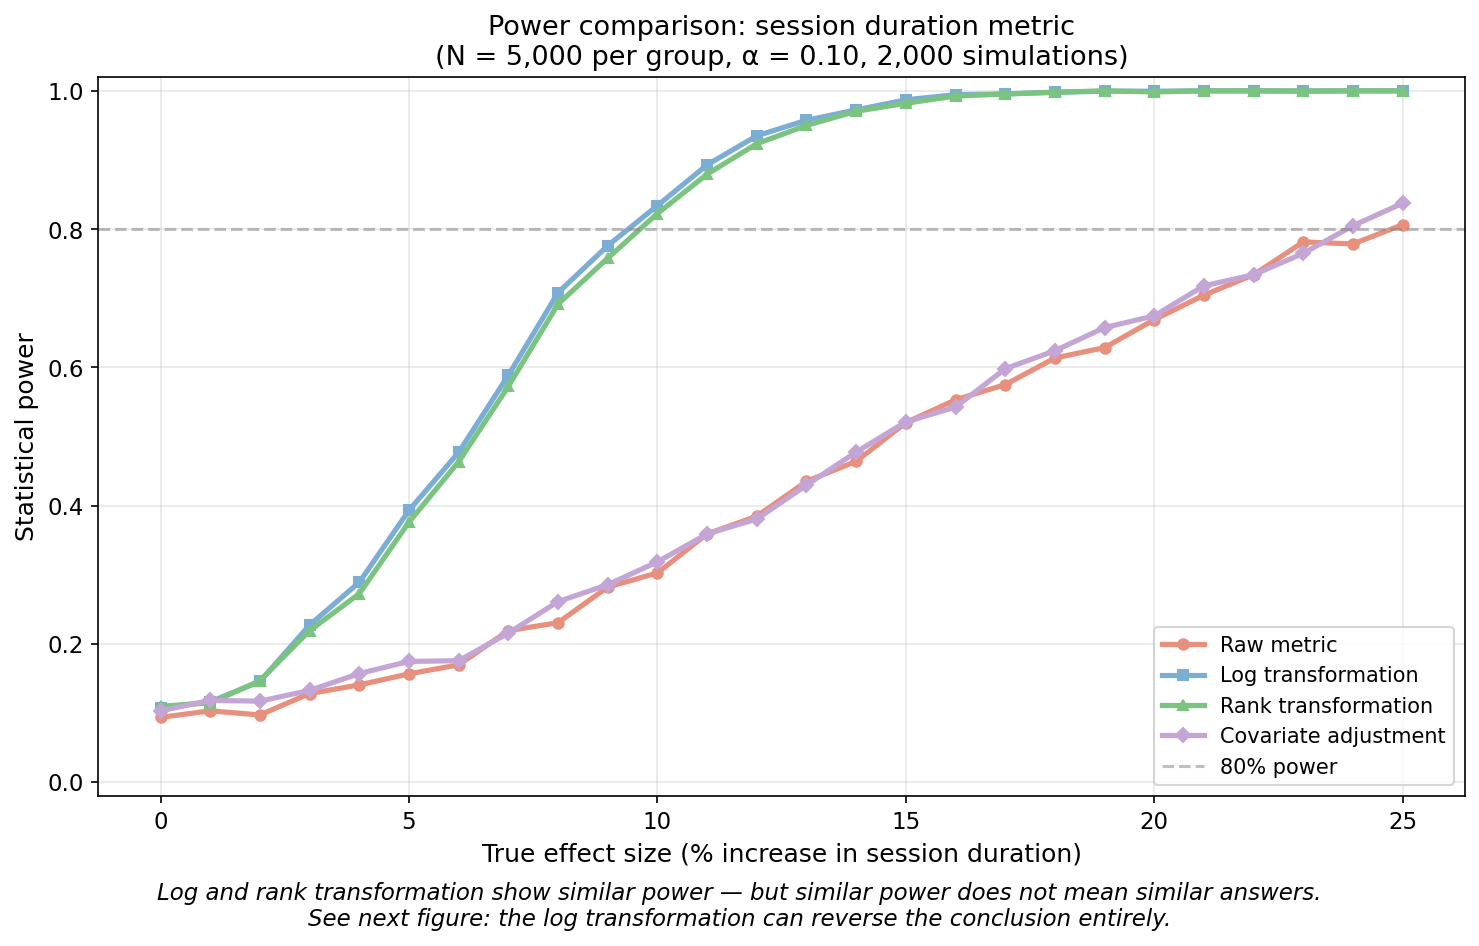
Both log and rank transformation reach 80% power at around a 10% effect size. The raw metric cannot detect even a 25% effect. Covariate adjustment barely improves on raw — with heavy tails, reducing variance by conditioning on pre-experiment data is not enough when a few extreme values still dominate. At first glance, log and rank transformations look interchangeable.
But similar power does not mean similar answers. The next figure shows what happens when the treatment increases variance — a common pattern when a feature engages power users more than casual ones. The arithmetic mean goes up. The geometric mean goes down. Same data, opposite conclusions.
![]()
The log-transformed t-test reports the treatment as harmful. The raw t-test and rank test both detect a positive effect. The difference is not power — it is what each test is measuring.
4. Choosing the Right Measurement
Any transformation is a measurement design choice — and every such choice requires four questions:
- What is the business question?
- What does the metric look like?
- What approach best reduces noise while preserving what the business cares about?
- Does it actually help? (power + false positive rate via simulation)
For our session duration metric, the first two answers are straightforward. The product team wants to know: does this feature make users stay longer? That is a directional question — not “by how many minutes” but “better or worse.” And the metric is heavily right-skewed, with a few extreme sessions dominating the variance.
The third question is where the real work is. We saw in Section 3 that covariate adjustment barely improved power on this metric — conditioning on pre-experiment data (Deng et al. 2013) does not help when a few extreme values still dominate. Log transformation has the power, but it changes the estimand: the geometric mean instead of the arithmetic mean, which can reverse the conclusion entirely. Rank transformation preserves direction, eliminates outlier noise, and — as we saw in Section 2 — answers a different statistical question than the t-test on raw data. For our directional question, that tradeoff is worth it. For a question about exact minutes, it would not be.
On the fourth question: does the chosen method actually deliver? The power comparison showed rank transformation reaches 80% power at a 10% effect size. But does it inflate false positives? All four methods maintain the nominal false positive rate.
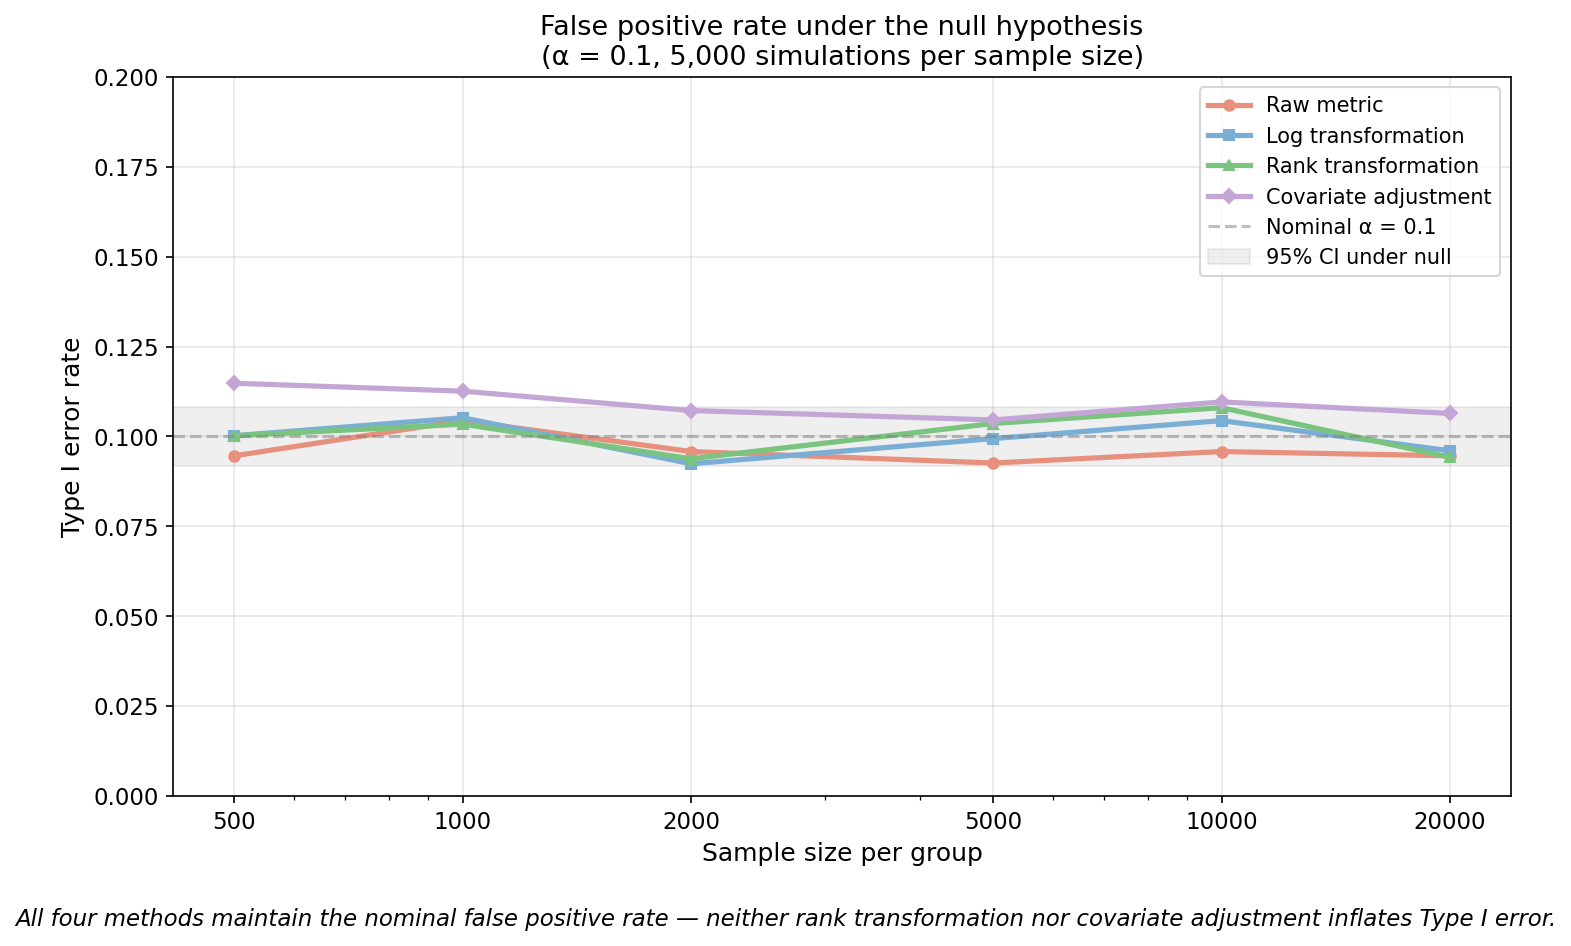
The business question should drive the choice — and always run sensitivity simulations on real data to verify the transformation actually helps for your specific metric.
5. The Bigger Point
We started with a session duration metric where the test returned \(p = 0.34\) — not because the feature failed, but because the measurement amplified noise from a few extreme sessions. The fix was not a bigger sample or a different test. It was asking: what do we actually need to measure, and what is getting in the way?
That question led to rank transformation in this case. In other cases it might lead somewhere else — covariate adjustment, winsorisation, ratio metrics. The tool changes. The process does not: start with the business question, understand what your metric does to the signal, and verify the method works on your data.
Most experimentation debates focus on which test to run. The teams that ship better products focus on what to measure.
Keep Going
For the full mathematical derivation and simulation results, see Increasing the sensitivity of experiments with rank transformation.